
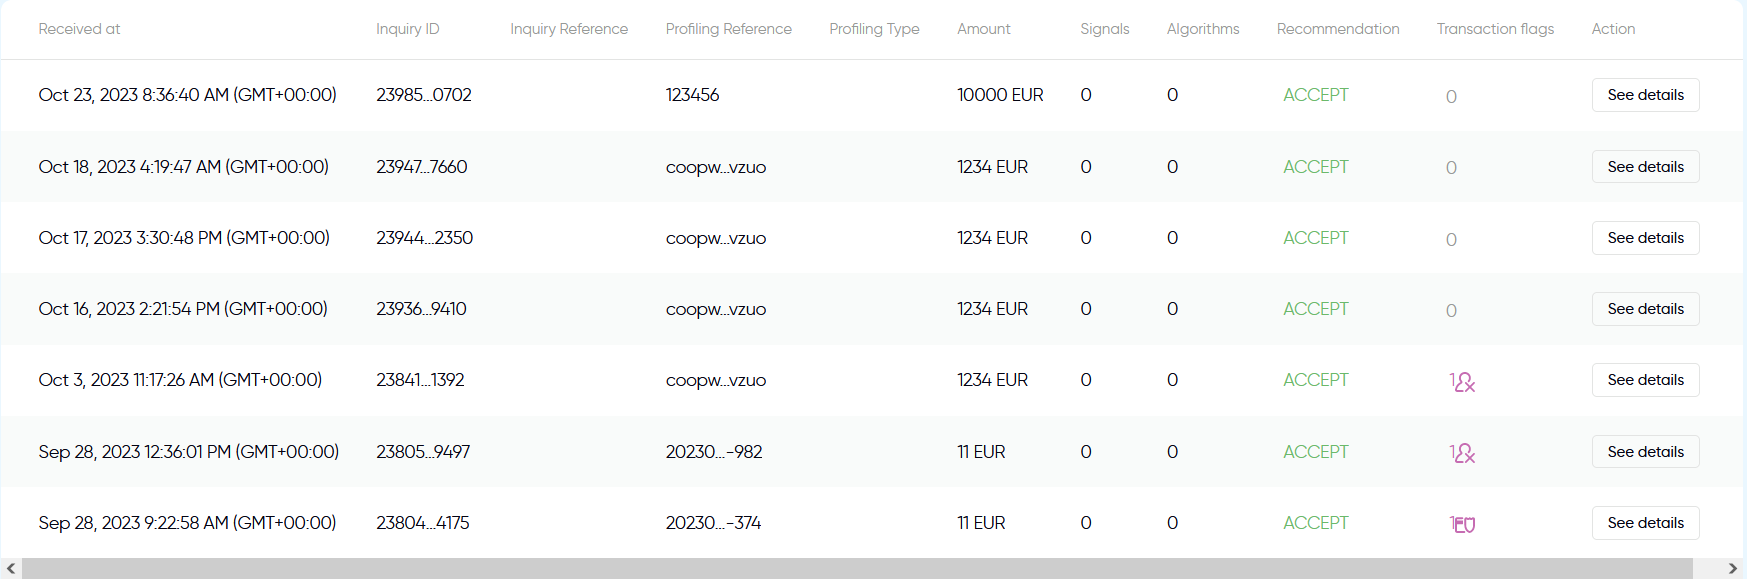
The inquiries view displays a list of all inquiries that match the requirements from filters. You can narrow down the list of inquiries by using filters bar or the search bar and by applying filters.

In the table, you can find information about:
- the timestamp at which the inquiry was sent (Received at),
- Inquiry ID which enables inquiry identification in Nethone system,
- Inquiry Reference which enables inquiry identification in your system,
- Profiling Reference which enables session identification,
- Type of the profiling session by platform (Web, iOS, Android, Platform agnostic), if this field is empty, it means that Nethone was not able to find a matching profiling session,
- Amount, i.e. a sum of all purchases,
- number of Signals triggered in a given profiling,
- number of Algorithms, i.e. a number of logic blocks that triggered a recommendation for a given profiling,
- Recommendation, which represent the recommendation that was provided as a response to this inquiry,
- Transaction flags, which inform how many and which transaction flags were sent for this inquiry.
By hovering aforementioned fields, you can find detailed information about an inquiry. Please, hover column:
- Inquiry ID, Inquiry Reference and Profiling Reference and click it to copy the value of the field to clipboard,
- Amount to view currency exchange (e.g. between USD and EUR) (Nethone can display the original currency of the inquiry and its translation to EUR and USD based on exchange rate on a day the inquiry took place.),
- Signals and Algorithms to view a list of triggered signals/algorithms,
- Transaction flags to see the list of the flags related to an inquiry.
By pressing the ‘See details’ button you can go directly to each inquiry’s detailed summary.
Particular inquiry
Once you press ‘See details’ button, you will be redirected to chosen inquiry’s details. There, you can find all information about the individual inquiry registered on your platform.

The top bar displays ID of a particular inquiry and application name (in case you have access to more applications).
Custom Tab
Custom Tab is a feature that allows you to personalize your view in Profiling section. You may choose the most useful widgets from different tabs and arrange them upon your personal preference to personalize your view, select "+" icon and start personalizing your display in Custom Tab view.

When you select 'Add widgets' button, a list of all available widgets will expand. You may choose from all widgets available to you in all tabs, including but not limited to:
- Signals summary,
- Algorithms summary,
- Identifiers,
- Card data,
- System blueprint,
- Map,
- Flights,
- Related profiling.
Please note that some widgets, e.g. Card data or Flights, may be available only to selected applications.

Once you have selected your preferred widgets, you may arrange their order by dragging windows above or under one another. In the top right corner of each widget, there is a bin icon that allows you to delete a selected widget from your customized view. Once you are content with the custom view, please click on Save button. Then, the Custom Tab will be displayed in profiling view.

However, if you decide to discard any changes made to Custom view, click on Cancel button in the top right corner. Please note that if you are accustomed to current view, you may keep on using default tabs and choose not to create your own Custom tab.
Timeline
Timeline summarizes user’s activity during a single user session. Listed actions may include events, inquiries, and transactions (depending on your API integration scope).
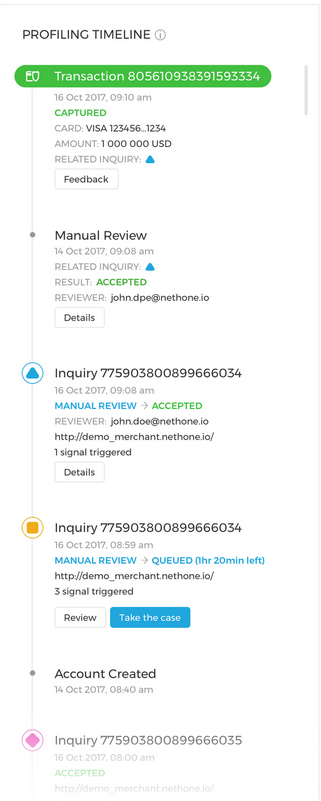
The timeline encapsulates information about all the inquiries within a single user session (inquiries have to share the same profiling_reference). However, you can also deactivate inquiries within the single user session and get the information summary about only those inquiries that are interesting for you.

The actions in the profiling timeline display the latest one at the top of the list. Note that each inquiry is assigned a symbol and color which, later on, will let you identify a specific inquiry in other sections of Profiling Details.

By pressing ‘Details’ button that is placed under an inquiry’s reference number, you can go into more detail about a selected inquiry. Here, you may also have a possibility to review a case. Please, learn more about Case Manager here.

For example, if a transaction turned out to be a fraud instance, a friendly fraud occurrence or was charged back after a few weeks, you can report it directly from the ‘Timeline’ section. To submit feedback, press Feedback button in the Timeline under the corresponding transaction description.

Next, choose the appropriate option: Chargeback, Fraud, Friendly Fraud. System will double check with you so if you make a mistake, you may click "No" in a pop-up window in the top right corner. If you want to copy the transaction reference, please hover the reference and use one click copy option. The transaction reference will be automatically copied to your clipboard.
Algorithm
This sections lets you look deeper into the logic behind AI recommendations.

Signals Summary
This section displays all the signals which were triggered during a single profiling and presents them as a circle chart. Signals, in short, are notifications about abnormal situations that may be indicators of higher probability of fraud.

There are multiple signals which can be activated by a user during profiling. Each signal is represented on a plot.
- Activated signals are color- coded by the inquiries which triggered them.
- Inactive signals are grayed out.
Do not worry if you do not recognize all signals and their meanings. Rest your mouse on a signal’s name and then, a short description of the signal will be displayed.
Multiple colors displayed in one signal mean that the given signal has been simultaneously detected in multiple inquiries
High variability of signals during one profiling session is a strong indicator of a fraudulent activity.
Decision Logic
Decision logic will give you some insight and visual presentation of how AI engines come up with particular decision. The algorithms that trigger a given recommendation for your system can be divided into:
- refuse/review/accept lists - which trigger ‘refuse’, ’review’ or ‘overriding_accept’ recommendations respectively
- Machine Learning models - which are a core of our system and bring superior quality to our analyses,
- Other - these algorithms origin from commonly called business intelligence or manual rules setup. They can be added by our Data Scientists as a result of thorough analyses of your business and its environment

Data
This section provides more insight into the user activity and their characteristics online.

Icons
Throughout this section, you may easily navigate thanks to small icons that represent particular inquiries. Icons are always placed on the left of a given data entry and they correspond to inquiry symbols in the profiling timeline.
If you hover the symbol next to the data entry, the profiling timeline will automatically scroll to the corresponding inquiry.
If there are more than three inquiries that match a particular item, the Panel will display all of them only after hovering over the inquiries symbols or ‘+3’ item.

Copy to clipboard
For your convenience, we have also introduced copying options for Panel elements. Please, click on a given element to automatically copy it to the clipboard.
Identifiers
This section lists all the available information about the profiling’s user. It includes:
- user reference numbers,
- e-mail addresses,
- IPs,
- phone numbers,
- cookies,
- stable fingerprints
- and volatile fingerprints.
Icons displayed next to each piece of information correspond to inquiries’ symbols during which they were captured.

Card Data
This section contains all the information about payment cards used by the user during the profiling. It includes following data: cardholder’s name, card brand, card’s BIN, cards’ issuing country, card level, type, and issuing institution. Widget is visible only for eCommerce clients.

If you hover the icon next to data entry, the profiling timeline will automatically scroll and redirect you to a corresponding inquiry.
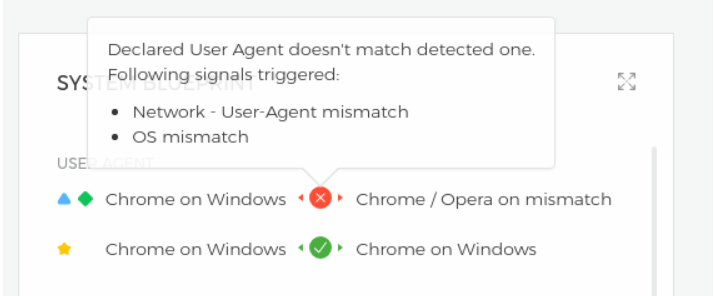
System Blueprint
The information contained in the system blueprint allows us to assess whether the data received from customer’s user agent matches user’s true browser characteristics. It encompasses data about user’s browser, operating system, connection type, system language, battery, local IP address, IP address hops, and timezone. Icons displayed next to respective elements correspond to inquiry symbols.

User Agent section informs you whether the user agent declared by the customer matches detected one. If not, then a red cross icon is displayed. to find out what signals were triggered, please hover the icon.
Map
eCommerce (transactions)
The Map displays information about the country where user’s payment cards were issued and where user’s IP addresses came from. Blue pins on the map display IP information.
By hovering over the pin you can view detailed information about the IP location. By hovering over the countries you can uncover more information about payment cards originating from the given state.
Loans
The map shows geographical occurrence of selected data types (e.g. IP address).

Related profilings
This section explains how the investigated profiling is related to other profiling in your database based on multiple features like user IP, cookies, e-mail address etc. There are two view options available: connection graph view and table view.
Graph (root node)
Each node on the graph represents a single profiling. An active profiling is represented by a bigger node with a circle around it. You may hover nodes to preview their details in a window on the left. At any time you can change the focus of the graph to a different profiling by pressing the corresponding node ("lock" icon will change automatically). If you wish to be redirected to a chosen profiling view, please click a link in a preview box.

All the nodes presented on the graph are related to each other by some feature, e.g. user reference, cookie, IP address, e-mail address and card token. Available features are represented on the graph by a colorful symbol.

You can customize the graph by changing the depth of the displayed connections and by selecting features to match upon. Press the settings icon in the upper left corner to apply changes and add filters to the graph. Hover over the nodes to see more information about related profilings.

Inquiry (DETAILS)
By pressing ‘Details’ button that is placed under an inquiry id, you can go into details of a selected inquiry in ‘Profiling timeline’.

Inquiries section is a summary of user’s behavior while making an individual inquiry. It encapsulates information about your customer’s keyboard usage, his behavior while filling out sensitive fields on your platform.