What is the  Reporter?
Using the Reporter you can view statistical data in an easily understandable way. You do not require any special database knowledge for the Reporter: when you click on the individual keywords you are presented all the data for selection. The clicked keyword turns green and all associated information appears automatically. The data is prepared in graphical or tabular form to make it clearer. You can print out or save all graphics and tables and use them in other programs.
Use of the  Reporter
In the following you will find explanations about how to use the Reporter as well as a description of the individual program components.

Below the toolbar containing the buttons for navigation, setting bookmarks, etc. are the grey tabs. Each tab represents a worksheet on which several objects are to be found. The most important objects are list boxes, diagrams, tables and pivot tables. The list box displays various values.
- List box: Each list box has its own title bar for distinction; if a list does not fit completely into the list box, you can scroll through the values that it contains with the scrollbar on the right-hand side.
- Table: The values of several boxes are displayed as a data set in the table area. Any desired boxes can be displayed as columns in table areas; possible combinations of values are illustrated in various lines.
- Pivot table: Pivot tables offer various options for the structured evaluation and clear summary of large quantities of data in tables. For example, you can easily retrieve overviews for certain currencies or payment methods itemised according to certain periods of time.
Selection boxes and status box
Selection

The selection actions facilitate navigation in the Reporter. If you click on a value in a list box, the other list boxes display all information pertaining to the selected value.
The program has two types of selection: Details and Cyclic. With Details the data are selected according to the specified hierarchy. The evaluation takes place in descending order, for example first according to years, then according to months, weeks and days. Without a certain hierarchy you can scroll cyclically through the data using the Dimension switching button; see the section concerned.
In addition you can directly change the selection in the table area. To do this, click inside the pivot table on a column header, for example Currency. The context menu which is then displayed enables the currency to be switched quickly, for example to GBP. If you wish to select several elements at the same time, keep the [CTRL] key pressed and mark the required values successively. All fields for which a selection filter is activated are marked by a small green square.
In addition you can change the selection by directly clicking on a value in the table. This could be a selection value on the left such as a card brand or a numerical value on the right in the data. With this method of selection, however, you should check which filter is actually set in the selection box at the bottom right.
The following practical example is intended to illustrate the method of working with the Reporter:
If you want to analyse the sum of the authorisations, captures and refunds for your merchant ID over several months of a year, classified by payment method, proceed as follows:
In the Reporter area, open the "Turnover overview" tab by clicking on it and then select the desired year in the "Year" list box (top right).
The background of the selected year turns green. The "Month" list box displays the months for which data is available on a white background. No data is available for the months with a grey background. To select several months, keep the [CTRL] key pressed and click on the desired months in the "Month" list box.
In the upper diagram you will now see the corresponding values in the form of a bar chart. Each bar represents a year. The monthly view is obtained by a double left-click on the Change Dimension button at the bottom right inside the diagram adjacent to the word "Year". The bars now represent the selected months.
The selection affects the total evaluation and each of the three evaluation tabs "Transaction overview", "Turnover overview" and "Monitoring of transactions". This means that the selection criteria remain active if you now switch to a different tab.
In terms of time you can refine the evaluation down to the hourly level. The Quarter, Month, Calendar Week and Day list boxes are available for this in addition to the Year and Month list boxes already used. In order to illustrate the course over the day, right-click on the Change Dimension button in the diagram (bottom right in the diagram) and select Hour.
Apart from the refinement of the temporal analysis, you can limit the evaluation to individual or several merchant IDs, payment method, card brands and currencies. Please note that the filters are interdependent here as well. For example, if you select PayPal as the only method of payment, then further limitation to certain card brands is not possible. All card brands then have a grey background.
If you select a method of payment and a currency on the left, then you will obtain a bar chart in the lower diagram where you can see the sum of the refunds, captures and authorisations at a glance.
Active selections can be deleted again in various ways:
- either by clicking on the "Clear" button in the toolbar,

- by clicking on the "Cancel selection" button (button is marked by an eraser) in the selection box,
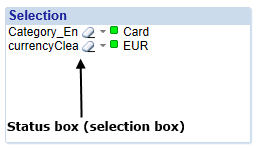
- by clicking with the right mouse-button and selecting the appropriate menu option,

- or by clicking again on the selected values with the [Ctrl] key held down.

Status box
An overview of the selection status helps when checking the selected values later. There is a status area on each tab for this.
Right and left mouse-button commands
The right and left mouse-button commands are context-sensitive, i.e. the available commands depend on which object is marked.
List boxes
The context menu of a list box offers the following commands:
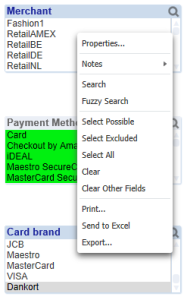
- SEARCH – opens the search window above the list box in order to search for a value in the list box
- FUZZY SEARCH – also opens the search window above the list box, but in this case a fuzzy search algorithm is used
- SELECT POSSIBLE – selects all values with a white background
- SELECT EXCLUDED – selects all values with a grey background
- SELECT ALL – selects all values in the list box
- CLEAR – clears all values previously selected in the list box
- CLEAR OTHER FIELDS – clears all values previously selected in other list boxes. As a result the selection in the current list box is retained, while all other selections on the worksheet are cancelled
- PRINT – displays the object as a picture in a new browser tab
- SEND TO EXCEL – the data can be saved with layout as an xls file or opened directly in Excel
- EXPORT – Exports the data in a new browser tab as text
Tables
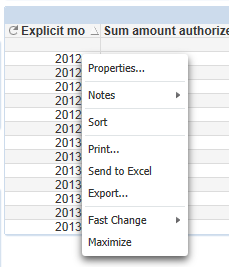
- SORT – sorts the data in ascending or descending order
- PRINT – displays the object as a picture in a new browser tab
- SEND TO EXCEL – the data can be saved with layout as an xls file or opened directly in Excel
- EXPORT – Exports the data in a new browser tab as text
- FAST CHANGE – switches the display to the diagram view
Text search and numerical search
The desired data can be filtered by a simple search:
- Click with the mouse on the title bar of the list box.
- Enter the first letter, which then appears in the search box. The list box of the value sought displays all data that begin with the letter entered. You can also enter the whole word or apart of it; make sure your entry is error-free, however.
- Confirmation with [ENTER] marks all applicable (suitable) values. Mark an individual value by clicking on it.
The following search methods can be applied:
As the result of the search (R) you will obtain all values that start with "R".
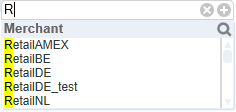
As result of this search (*test*) you obtain all values containing the letter sequence "test".
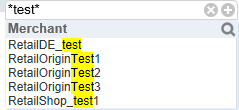
Menu bar commands
Forwards and backwards
The two simplest evaluation commands are located in the toolbar. The two buttons, backwards and forwards, are marked by two arrows: the arrow pointing to the left is for backwards and the arrow pointing to the right is for forwards. By clicking on these buttons you can undo or redo one or more steps.
Locking and releasing selections
In order to prevent inadvertent deletion, you can lock the selection. To do this click on the "Lock selection" button, which is depicted by a closed padlock. If you execute this command you can click at will without changing anything inadvertently in the process. The values are released by clicking on the "Release selection" button, which is depicted by an open padlock.
Undoing layout changes
Use the Undo or Restore buttons shown adjacently to undo changes made to the tables, for example if you have moved columns, closed individual columns of pivot tables or minimised diagrams.
Diagrams and tables
This section explains about working with diagrams and tables. Both types of worksheet object serve to illustrate data.

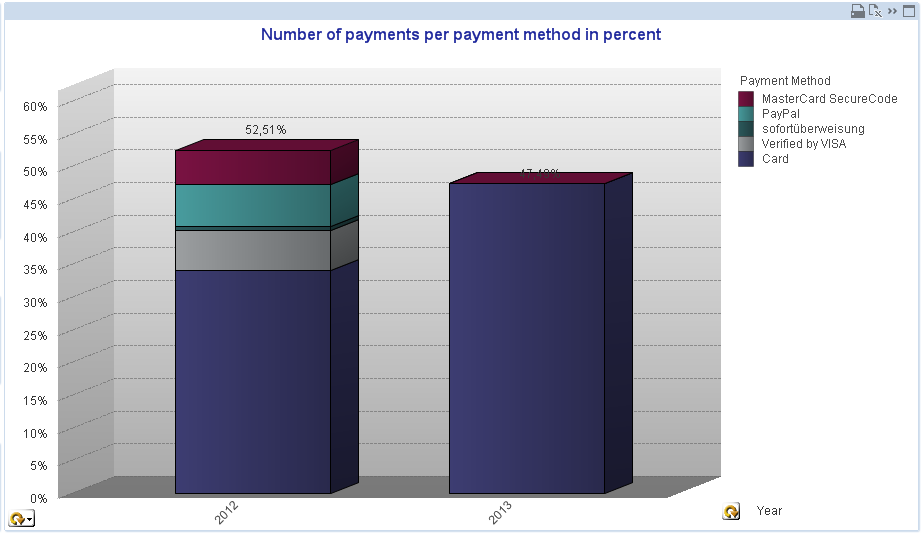
In a diagram data can be emphasised by a detail, whereby all other data are masked out. Keep the left mouse-button pressed and mark all desired data in the diagram, until their background turns green. The selected bars are enlarged as a result and other bars are masked out. In the following example the time period is limited:

from 2012 to 2013 (above) to time period 2012 (below)
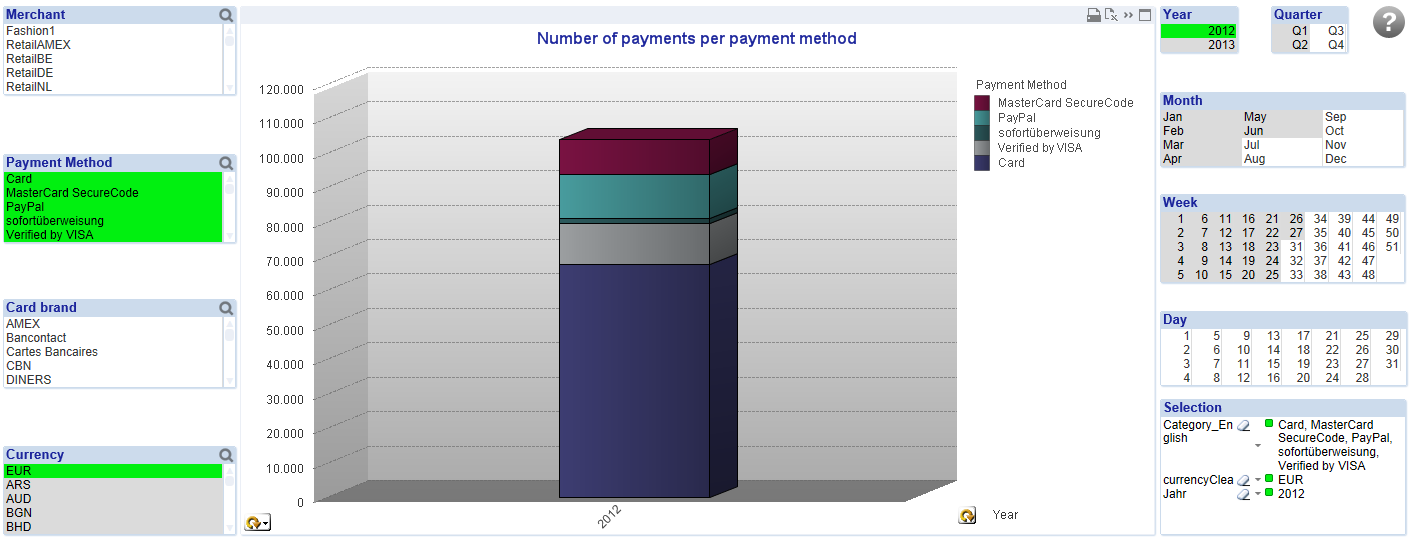
In the same way the displayed categories can be observed with greater focus:

the Card payments are no longer displayed below.

Please note that in this and the previous example the corresponding fields in the selection boxes are also given a green background by selection with the mouse.
Change Dimension button

This button permits you to scroll cyclically through the data without proceeding hierarchically. Nevertheless the order is usually descending, i.e. from the highest level (e.g. year) to the lowest (date).


Clicking on this button with the right mouse-button displays all available changeover options:

Change Equation button
This button permits cyclic scrolling through the possible equations in a table or a diagram. (Third column in the example: ‘Number of payments per payment method’)
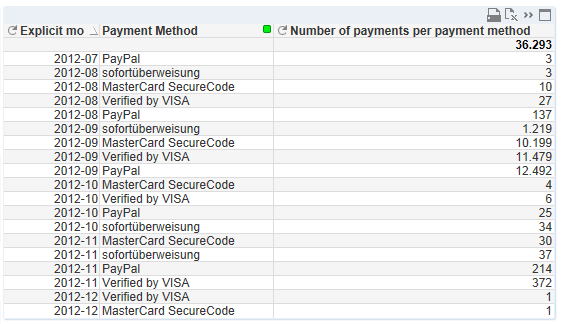
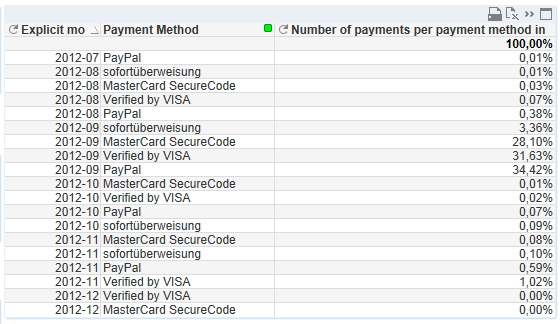
In the case of diagrams the changeover takes place by pressing the left ![]() button
button


Tabs and tables
The reporter offers various tabs for specific data evaluation tasks, which you can change above the table and diagram area.
On the Transaction overview tab you can find information about the number of transactions on the basis of the process date (Payment created).
On the Turnover overview tab you can find information about the amounts/total amounts of the transactions on the basis of the transaction date (XAction created).
The Monitoring of transactions tab is for error analysis. Here you can find information based on the transaction date (XAction created). Instead of the amounts and sums, however, error codes and error descriptions are shown here. These parameters are switchable, as are the country of origin of the card, the country of origin of the IP address and the BIN.
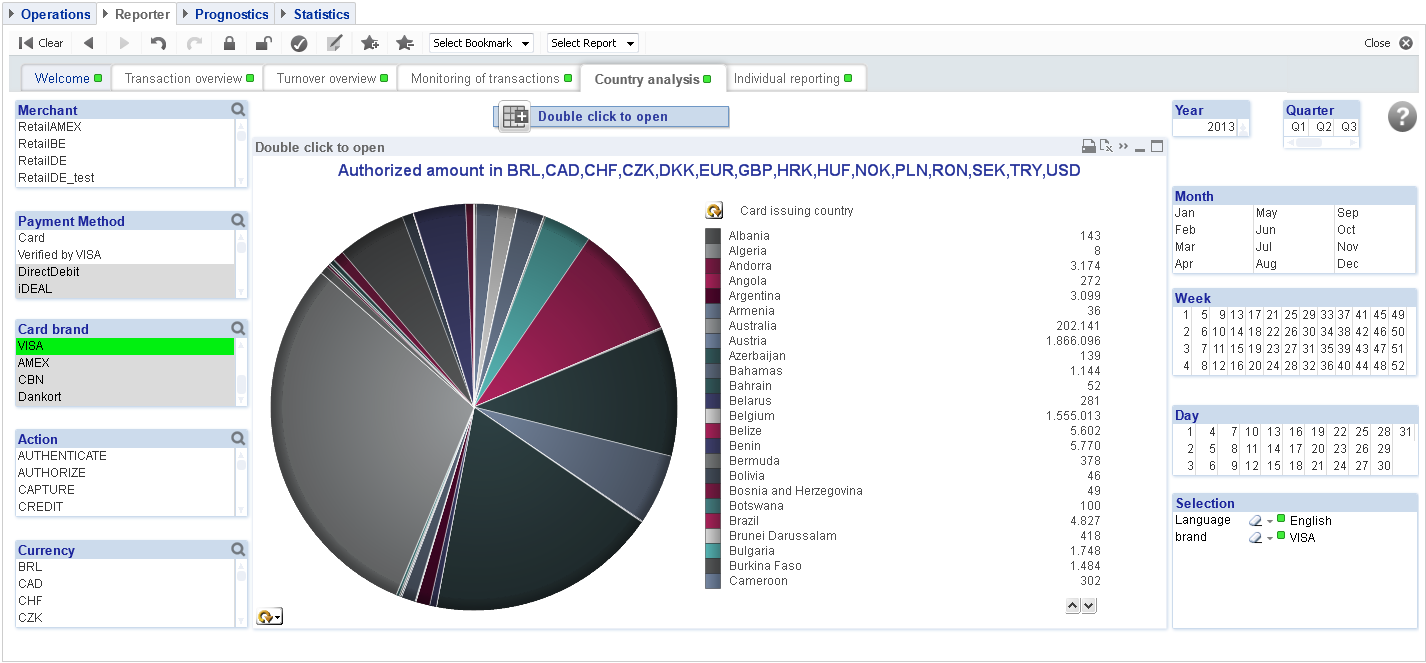
The Country analysis tab enables evaluations of the number of transactions and amounts on the basis of the country of origin of the card, country of origin of the IP and BIN as well as to payment method, currency and MID, grouped according to the selected time dimension. A totals column on the right provides a summary of the values. The information is displayed as a pivot table or as a pie chart.

Operation
On each tab you can have the data displayed in tabular form or as a diagram. To change or open a certain view, double-click on the relevant button at the top centre on the respective tab.
![]()
You can minimise the table or diagram with the usual small window control button in the display area. This also takes place automatically if you open another view.
The column width can be changed as desired by dragging with the mouse: keep the left mouse button pressed until the desired column width is achieved. This column width is adopted for the entire table.
Columns can be moved within a table by means of drag & drop, whereby you can adapt the hierarchy of the evaluation. For example, you can place the Currency column in front of the Merchant column. Note, however, that the columns further to the right in the data area behave differently. These cannot be moved individually amongst one another, but they can be moved as a block to the left, so that together they then become row fields of the pivot table and create a further subdivision there, leaving only the years as columns. You can similarly undo this restructuring by drag & drop.
Explanations about dimensions and values
Short explanations about values, dimensions and functions can be found in the help function, which you can activate by clicking on the question mark icon at the top right of the window. The information shown depends on the view that is currently opened.

For example, an explanation is given there that the refund rate is calculated as the quotient of the sum of the credits divided by the sum of the amounts captured.
The card issuing country indicates the country of origin of a credit card determined on the basis of the BIN (Bank Identification Number). The BIN forms the first 6 digits of the credit card number, wherein its structure is defined in the ISO 7812 standard. Furthermore, the Geolocation of IP provides information about the country of origin of the IP address used as determined at the time of the payment.
A value “n/a” in the table means ‘not available’. It is displayed if, for example, the country of origin of the card is unknown, as in the case of PayPal.