
These charts give you a quick overview of the origin of your operations.
| Page properties | ||||
|---|---|---|---|---|
| ||||
|
| Page properties | ||||
|---|---|---|---|---|
| ||||
|
Overview of the origin of the operations
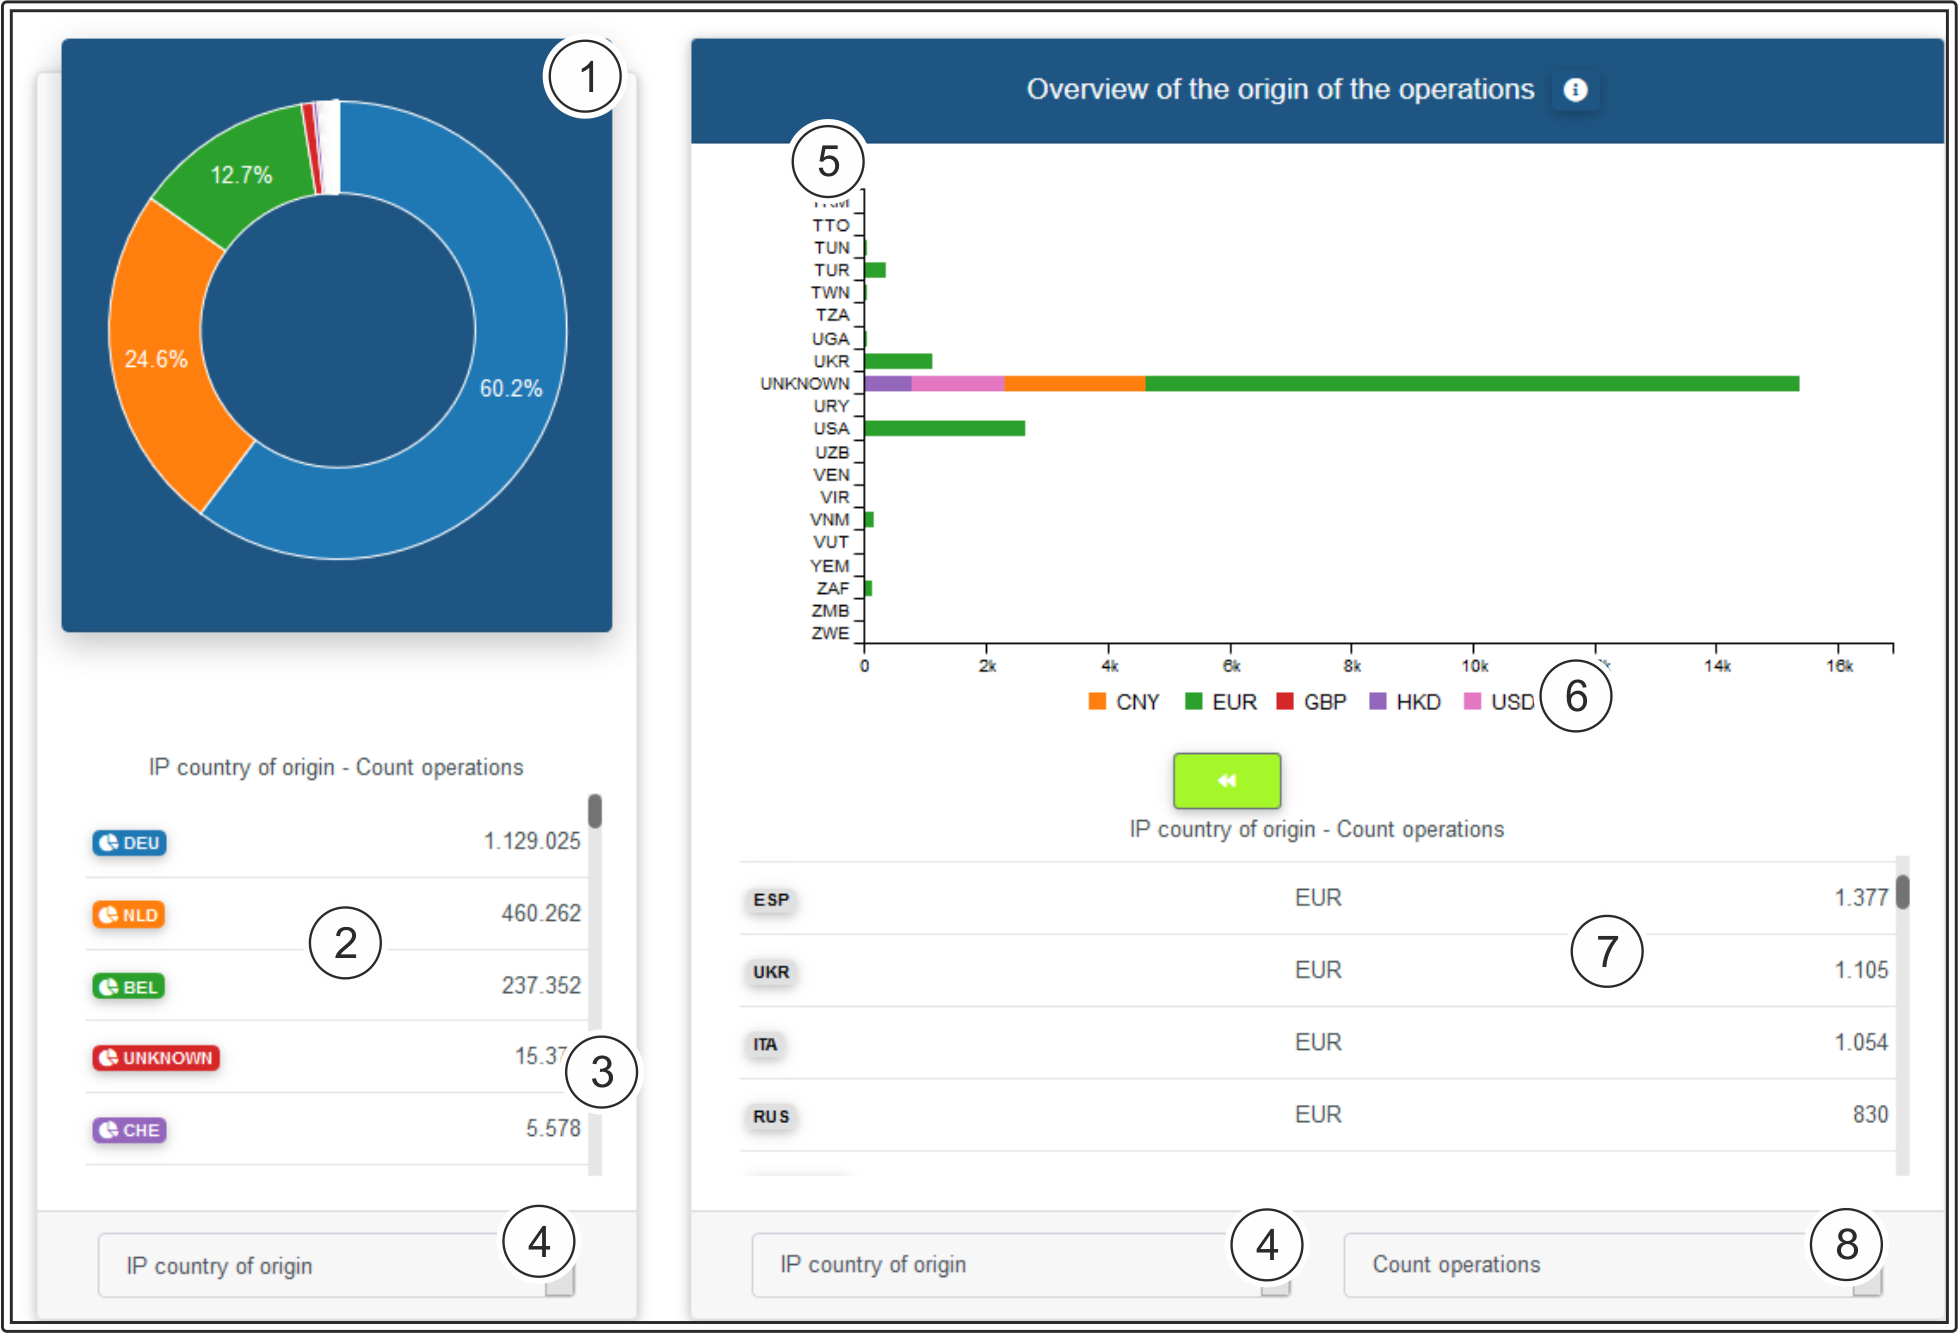
- Percentage accounted for by the countries of origin shown as a circular chart
- Number of operations per country of origin
- Hide country of origin
- Filter setting for the origin category
- Origin of the currency by country
- Currency
- Table showing content of chart
- Display by types of operation: authorised amount, captured amount, refunded amount and number of operations
| Info | ||
|---|---|---|
| ||
Click on a country of origin to have it hidden in the circular chart. The percentage is distributed among the remaining paymethods. |
Detailed view of the origin of the transactions
The following table shows you your transactions according to the different origin criteria.

- Search function for each column
- Export the current table contents as an Excel file
- Configure column configuration
- Filter setting for the origin category
| Info | ||
|---|---|---|
| ||
You can use the "Column configuration" button to configure columns individually. The column headings highlighted in green are shown. Clicking them allows you to hide the columns shown. In turn, you can make the hidden column headings, which are highlighted in white, appear by clicking them. |
Trend according to the origin of the operations
This evaluation shows you the trend in operations according to the different criteria for origin.
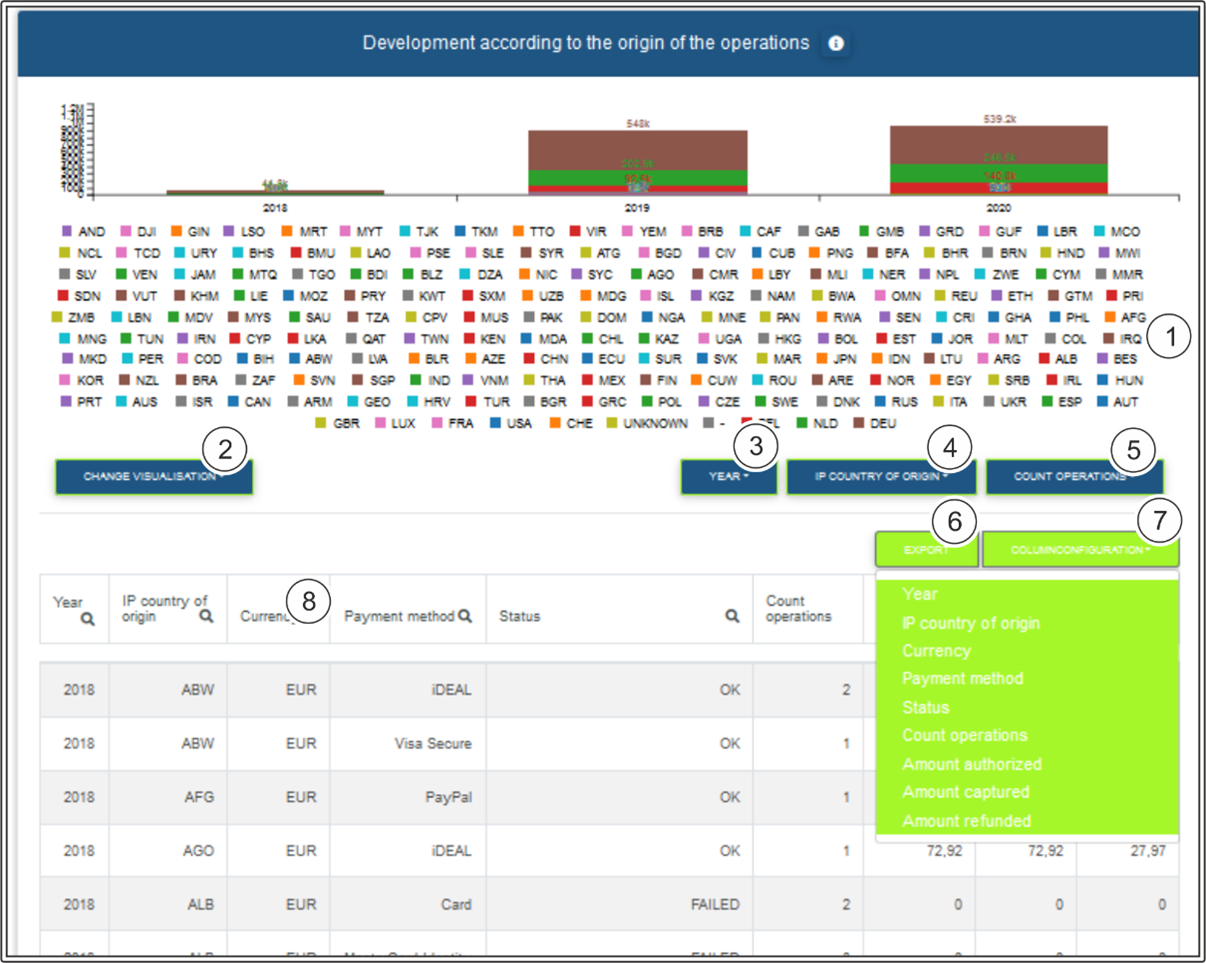
- Countries of origin of the operations
- Select the following types of chart: line chart, bar chart, curve chart and area chart
- Select display by year, quarter, month, week and date as intervals
- Origin category
- Display by types of operation: authorised amount, captured amount, refunded amount and number of operations
- Export the current table contents as an Excel file
- Configure column configuration
- Search function for each column
| Info | ||
|---|---|---|
| ||
You can hide individual countries of origin by clicking on them. Clicking on them again makes the countries of origin appear. The countries of origin that have been greyed out are hidden, and are not shown in the chart. |
| Info | ||
|---|---|---|
| ||
The interval "Date" shows the daily trend for the last 2 weeks. |
| Info | ||
|---|---|---|
| ||
You can use the "Column configuration" button to configure columns individually. The column headings highlighted in green are shown. Clicking them allows you to hide the columns shown. In turn, you can make the hidden column headings, which are highlighted in white, appear by clicking them. |
Complete view of the origin of the operations
The following table shows you your combined operations according to the different origin criteria. The complete view provides you with the option of comparing the origin criteria with each other.
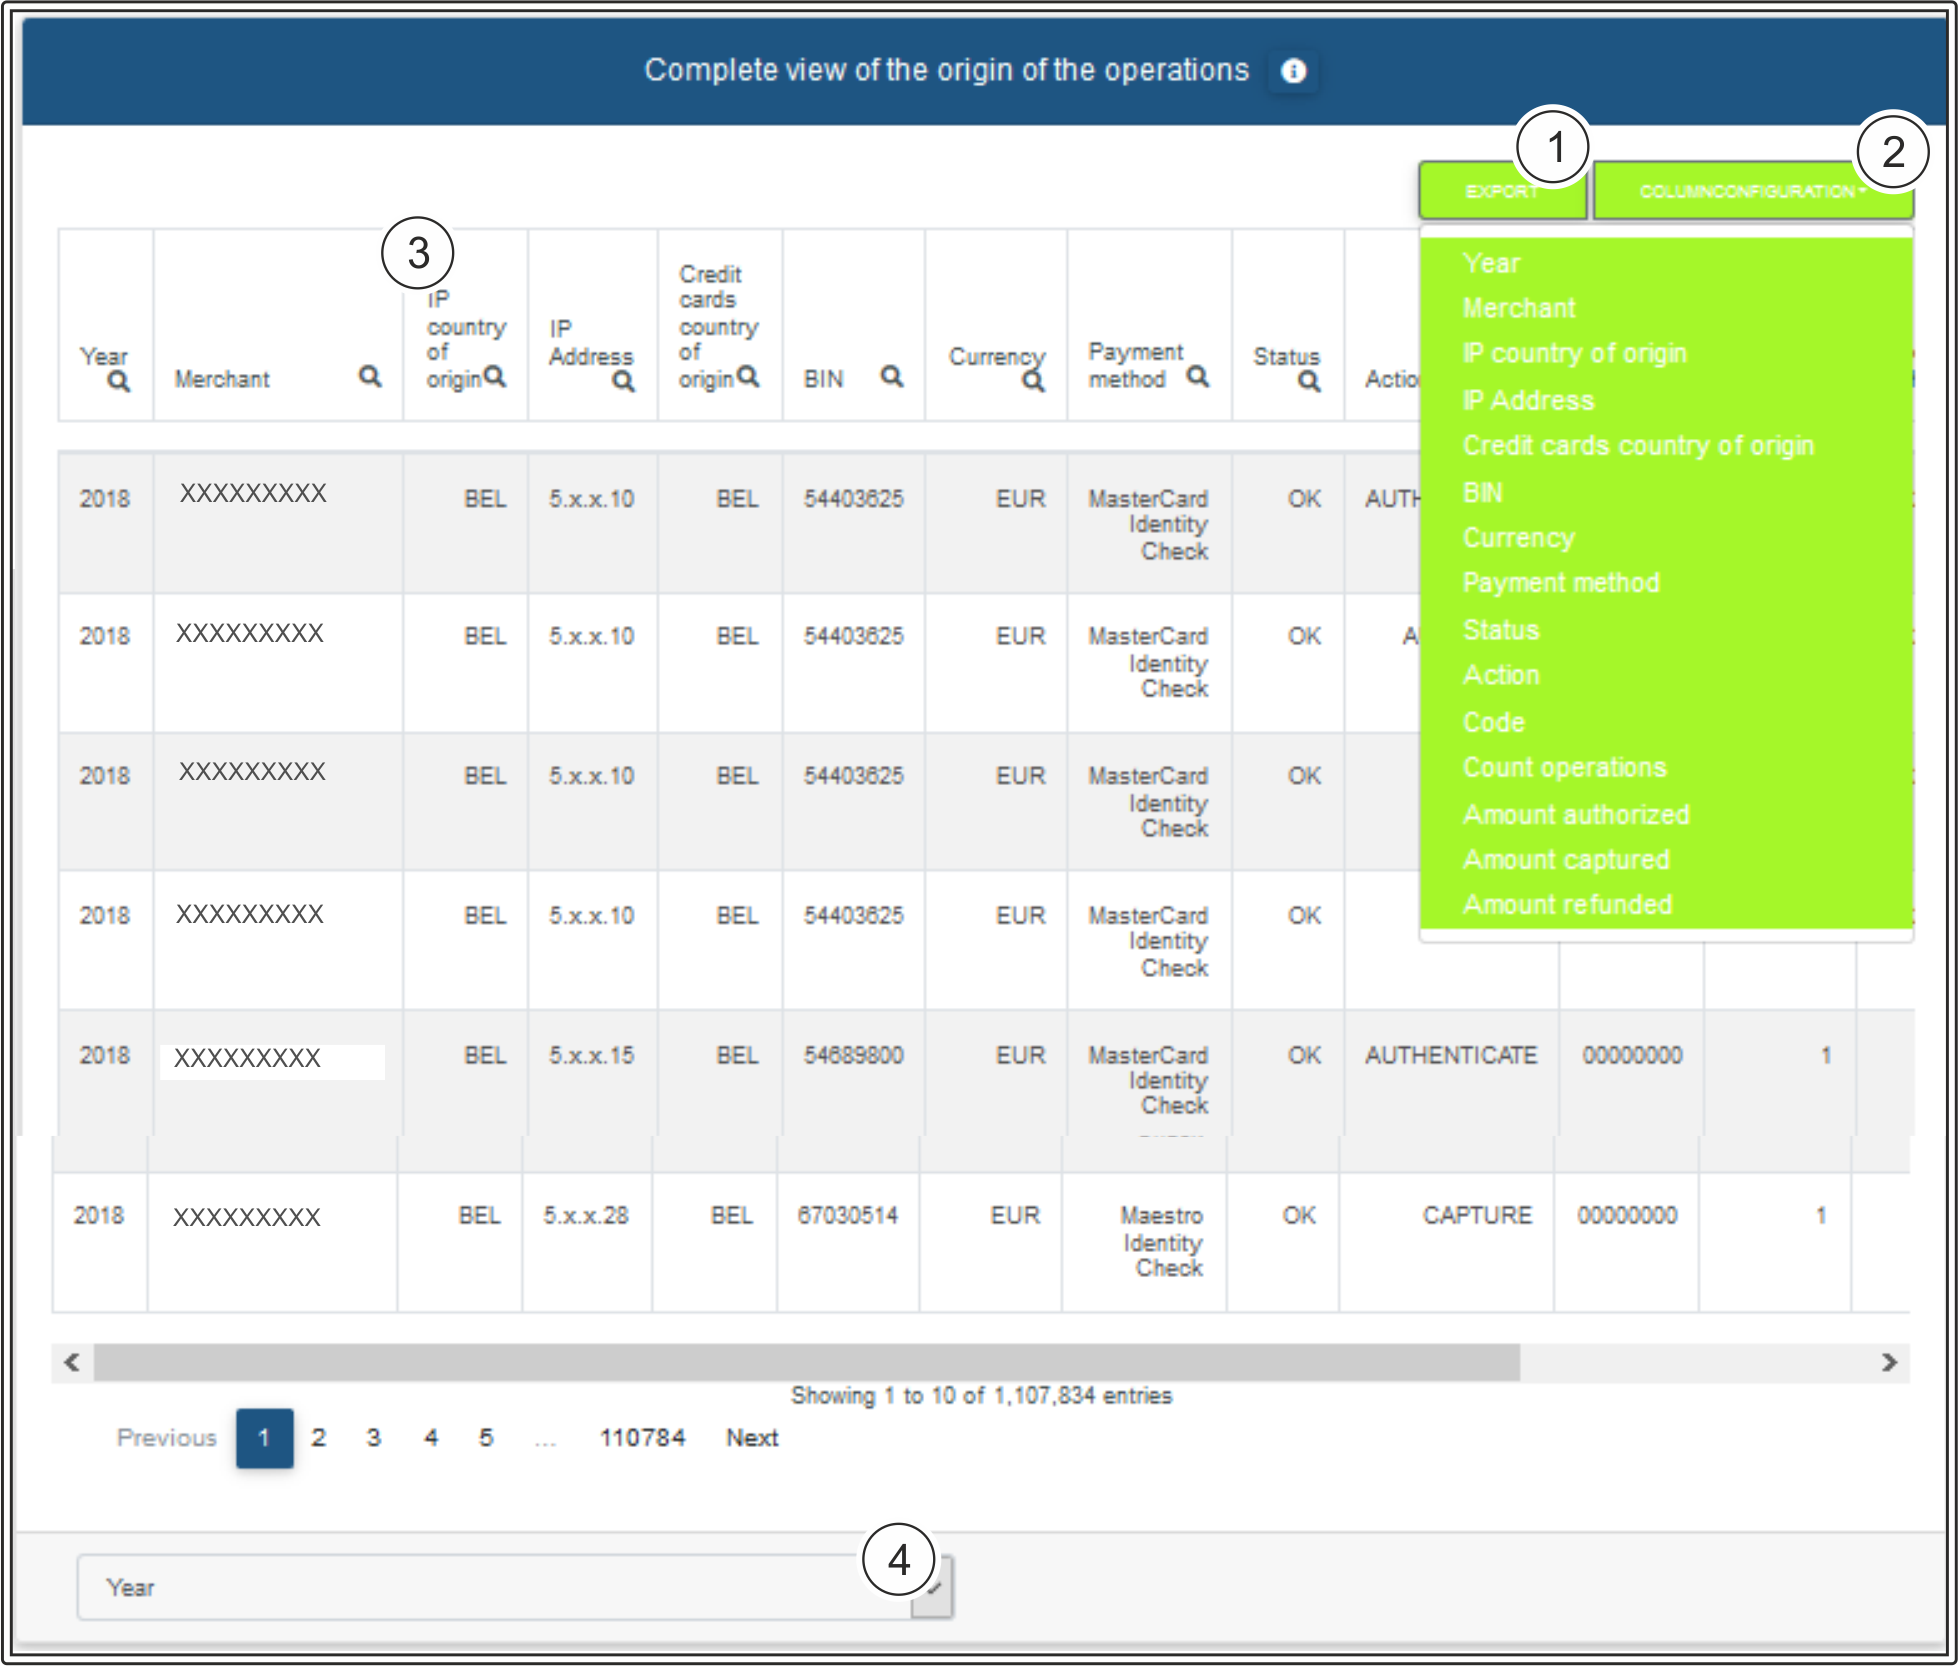
- Export the current table contents as an Excel file
- Configure column configuration
- Search function for each column
- Select display by year, quarter, month, week and date as intervals
| Info | ||
|---|---|---|
| ||
You can use the "Column configuration" button to configure columns individually. The column headings highlighted in green are shown. Clicking them allows you to hide the columns shown. In turn, you can make the hidden column headings, which are highlighted in white, appear by clicking them. |
Country overview
The world map gives you a quick overview of the origins of the transactions. In this case, the capital city of the country of origin is highlighted and weighted in accordance with the number of operations. The larger the colour circle in a country is, the more operations were carried out.
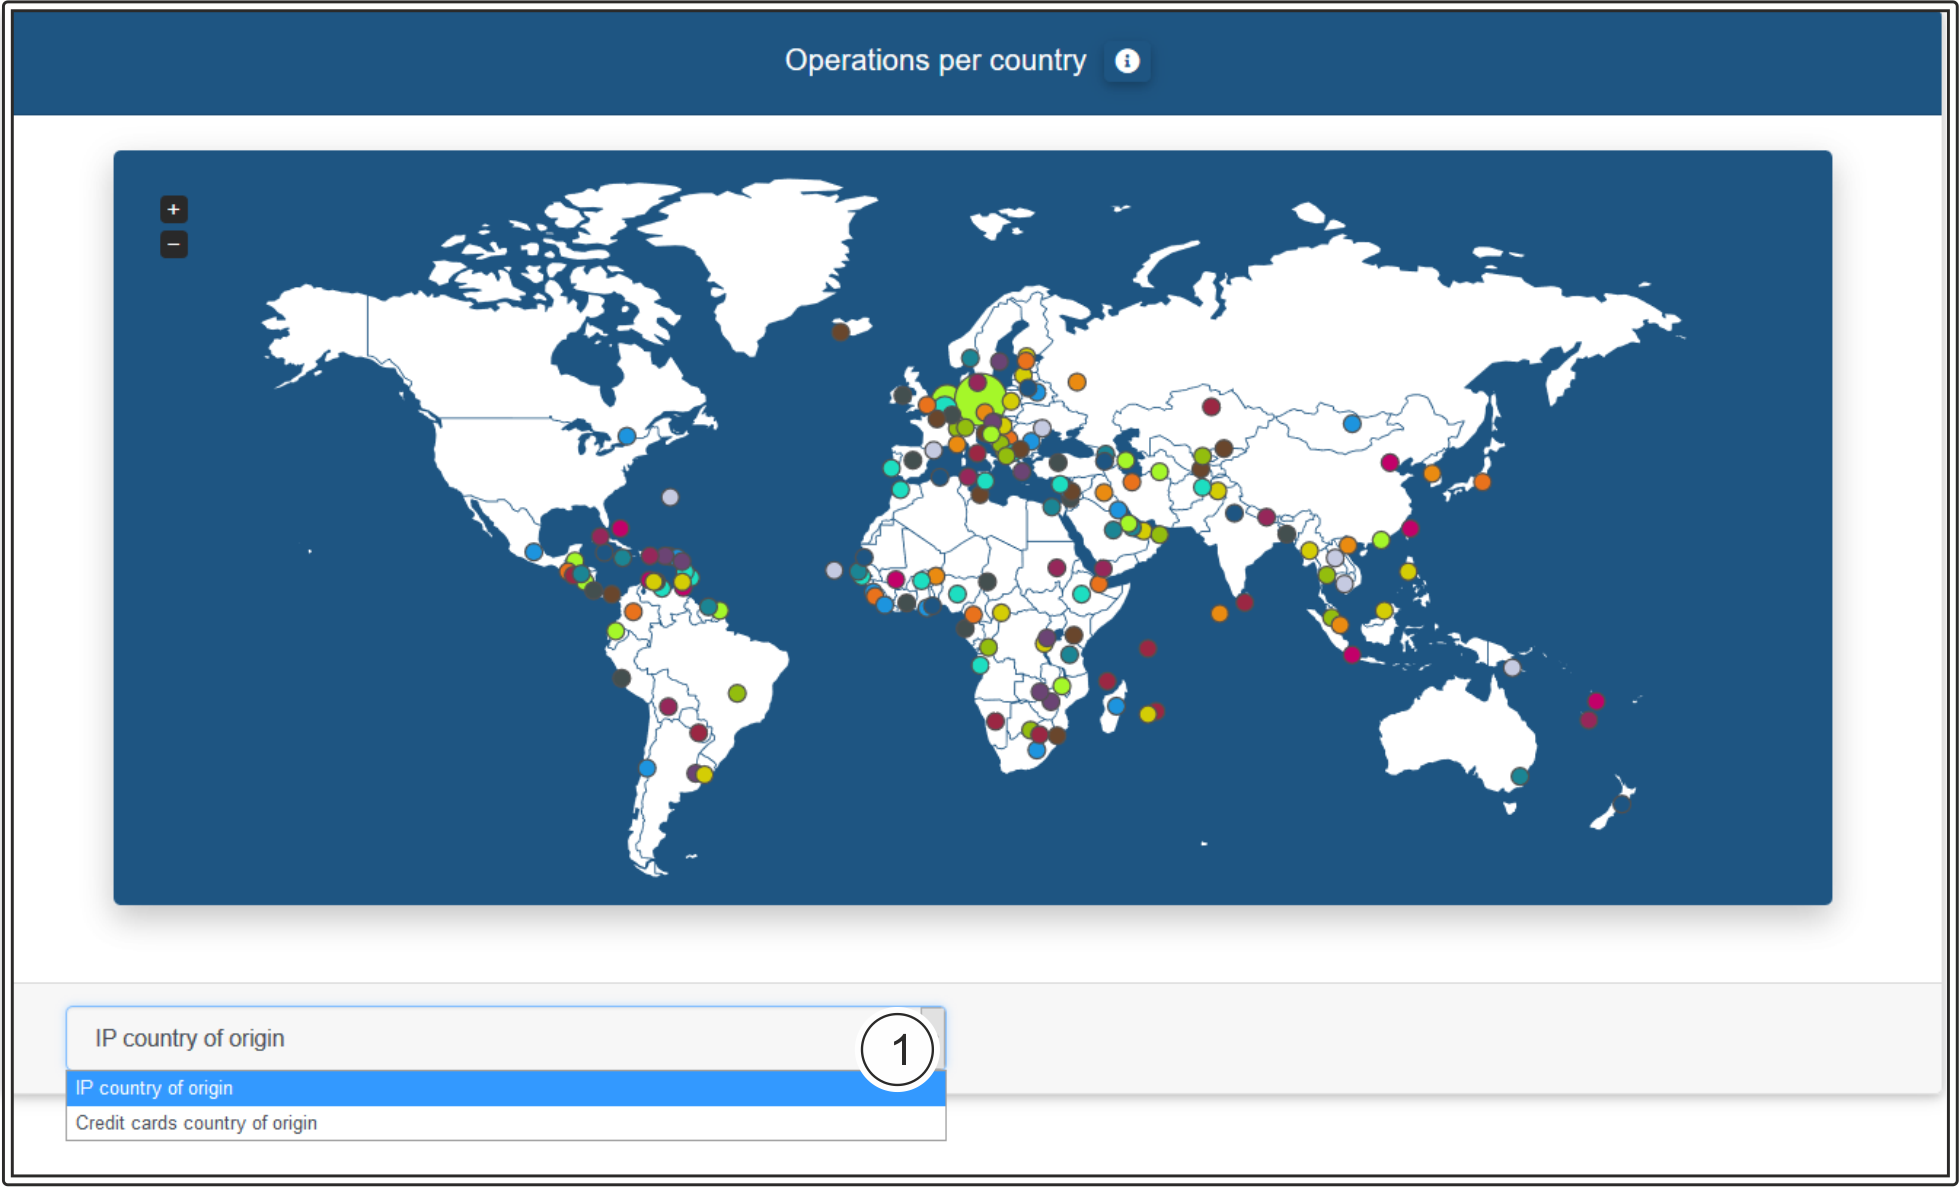
- Selection by type of origin: IP of the country of origin or the country of origin of the credit card
| Info | ||
|---|---|---|
| ||
| You can identify the number of operations by the size of the circle. The larger the circle, the more operations were carried out in that country. |
| Multiexcerpt include | ||||||||
|---|---|---|---|---|---|---|---|---|
|
| Linchpin Teaser | ||||||||
|---|---|---|---|---|---|---|---|---|
| ||||||||
On this page
| Table of Contents | ||
|---|---|---|
|
In this section
| Content by Label | ||||||||
|---|---|---|---|---|---|---|---|---|
|